Loading…

Loading…
The measurement that was missing
We weigh how much a porous material takes up and lets go, on the solid itself, while it works in the liquid. No subtracting one solution reading from another.
The standard method
Measure the liquid, then infer the solid.
A number you act on but never actually read.
Now
We read the solid directly.
Measured on the material itself, live in the working liquid.
Backed by 14 peer-reviewed papers
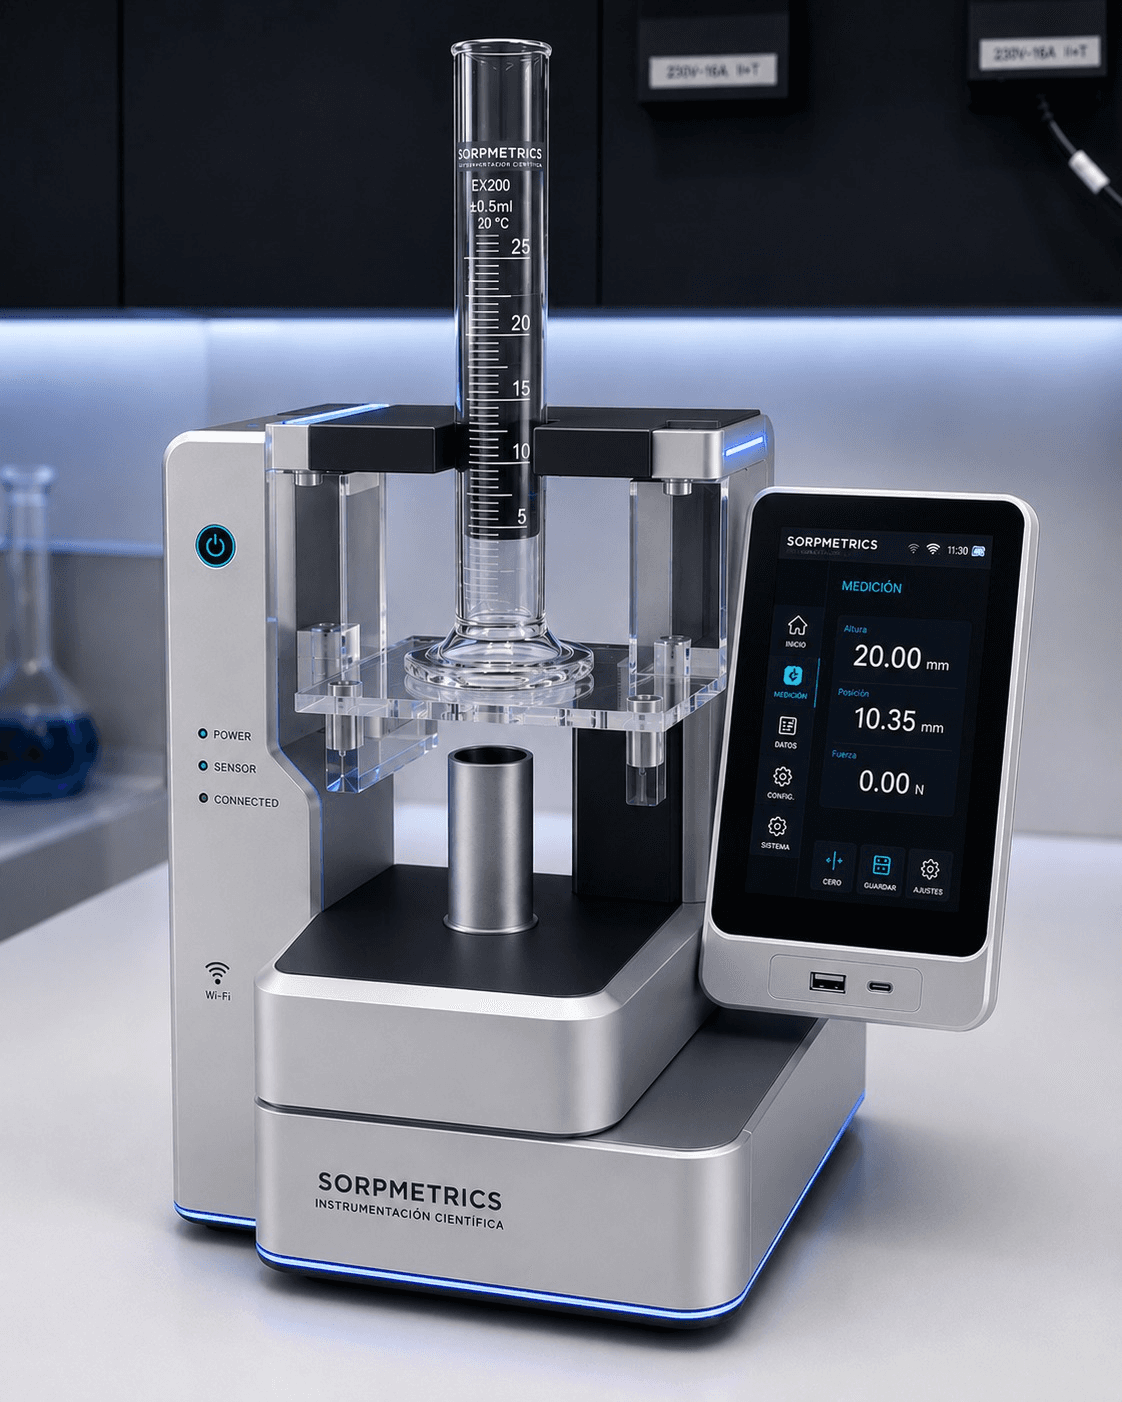

Sorpmetrics. We make adsorption visible. The whole point of a porous material is what it holds — so we made that holding something you can watch and weigh.
Where we unlock discovery
Measure drug uptake and release directly on the carrier in liquid, no guesswork.
ExploreRank wet CO₂ sorbents under actual working conditions, not dry data that lies.
ExploreScreen MOF libraries on the solid, one calibration per material.
ExploreCatch a weak sorbent batch on real-water uptake, before it reaches service.
ExploreRank a library against your analyte, one calibration per material.
ExploreRank fillers on uptake weighed in the working mixture, not inferred from flux.
ExploreMeasure DAC coating capacity when wet; your dry datasheet is likely wrong.
ExploreThe outcome
Calibrate a material once, then run any analyte against it. Every figure is read off the solid, with the papers to back it.
Signal tracks adsorbed mass linearly on commercial MOFs.
That +5.2 wt% gap is the CO₂ on the solid the conventional gravimetric method under-reads, because it weighs the system from the outside and never looks inside the material. It is one proof-of-mechanism result on our reference Cu₆Cr SMOF: evidence about measurement accuracy, not a guarantee of capacity in any particular material or application.
Co-authored by our CTO with the UPV/EHU group, backing the method in print.
Capabilities
Adsorption & desorption profiles
Five ways we read the loading directly on the solid, in the working liquid. Choose a mode to see its characteristic profile, the device it runs on, and the minimum material we need to load — then add the studies you want and book them together. Every curve here is illustrative, not client data.
Illustrative — Capacity read: ≈ 18.6 wt% at the plateau
Equilibrium loading
≈ 18.6 wt% at the plateau
The loading read directly on the solid in your working liquid as it climbs to equilibrium — not inferred from the liquid by difference. One material, one analyte. Real numbers come from your samples after a feasibility check.
Your booking
Add the studies you want above — book one, or several together, in one trip.
How we start
Ready when you are
Start with a feasibility check — we confirm the fit and define the use case with you.